
Guide
How Much Solar Panels Really Generated in Northern Ireland in 2026, Month by Month
Modelled NI solar generation for 2026: 4kW and 6kW output for seven towns, February to September, plus year-to-date totals, best and worst days, and the method behind the numbers.
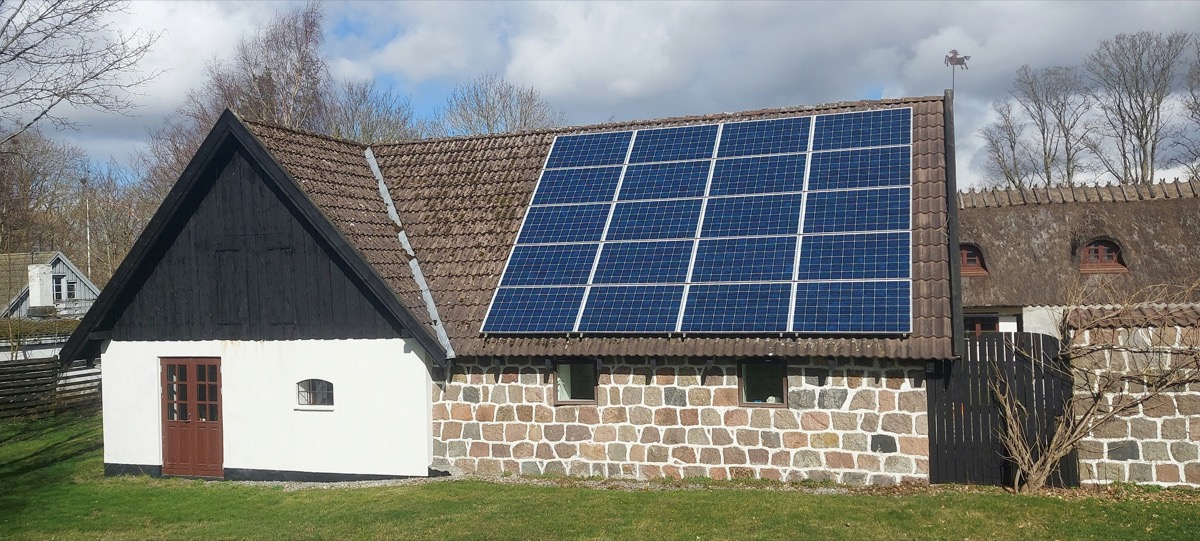
I have read 368 quote requests through this site since March, and the same question sits under most of them. How much would panels actually make on my roof, here, in this weather.
Nearly every figure quoted at Northern Irish homeowners in answer to that comes from somewhere else. Annual yield tables built on Great Britain averages, and installer brochures quoting “typical UK” numbers. None of it tells you what a roof in Ballymena did last July.
So I started measuring. Since 24 January 2026 I have run a daily generation tracker for seven Northern Ireland towns on this site, modelling what a 4kW and a 6kW system would have produced from the radiation actually recorded at each location. This page is the full 2026 record to date, published so you can hold your own inverter app up against it and see whether your system is behaving.
Everything below comes from that dataset, checked on 6 September 2026, corrected on 23 September 2026 and extended with September’s figures on 1 October 2026. The method is set out in full further down, including what the numbers are not.
Year to date: what a 4kW and 6kW system generated
The tracker has 250 days of recorded weather on the clock, from 24 January to 30 September 2026.
| Town | 4kW kWh | 4kW at 33.5p | 4kW at 29p | 6kW kWh | 6kW at 33.5p | 6kW at 29p |
|---|---|---|---|---|---|---|
| Newry | 2,486 | £833 | £721 | 3,729 | £1,249 | £1,081 |
| Belfast | 2,445 | £819 | £709 | 3,670 | £1,229 | £1,064 |
| Lisburn | 2,373 | £795 | £688 | 3,562 | £1,193 | £1,033 |
| Armagh | 2,341 | £784 | £679 | 3,511 | £1,176 | £1,018 |
| Enniskillen | 2,243 | £752 | £651 | 3,366 | £1,128 | £976 |
| Ballymena | 2,242 | £751 | £650 | 3,364 | £1,127 | £975 |
| Derry | 2,214 | £742 | £642 | 3,321 | £1,113 | £963 |
Two things worth saying about that table before anyone quotes it.
The first is that it stops on 30 September. It has no October, November or December in it. A full calendar year will sit higher, though not by much, because the last three months of an NI year are the quiet ones.
The second is the money. The tracker’s own tariff assumption is 33.5p per kWh, which was Power NI’s standard credit rate when I set it. Power NI’s domestic unit rates from 1 July 2026 run from 32.10p per kWh on monthly direct debit with online billing to 34.15p standard, both including VAT, checked on 23 September 2026. So I have also shown the same output at 29p, a deliberately cautious figure below any Power NI domestic rate. Use whichever matches your bill.
Either column is the gross value of the electricity produced, not a cheque. You only keep the full 30p-odd on units you use while they are being made. Exported units earn a few pence, because the Smart Export Guarantee is a Great Britain scheme and does not extend here, so NI suppliers pay voluntarily and set their own rates. Our guide to solar export payments in NI covers who pays what.
Compare quotes from MCS-certified installers across NI, free, no obligation: get three quotes.
Month by month, February to September 2026
Here is a 4kW system, in kWh, for every town and every full month tracked this year.
| Town | Feb | Mar | Apr | May | Jun | Jul | Aug | Sep | Feb to Sep |
|---|---|---|---|---|---|---|---|---|---|
| Armagh | 88 | 207 | 331 | 394 | 356 | 460 | 284 | 203 | 2,321 |
| Ballymena | 80 | 193 | 326 | 408 | 335 | 437 | 272 | 178 | 2,229 |
| Belfast | 86 | 213 | 348 | 415 | 369 | 489 | 291 | 218 | 2,429 |
| Derry | 92 | 198 | 322 | 380 | 345 | 404 | 262 | 194 | 2,196 |
| Enniskillen | 87 | 188 | 307 | 396 | 347 | 440 | 269 | 193 | 2,227 |
| Lisburn | 84 | 196 | 331 | 412 | 359 | 478 | 299 | 198 | 2,356 |
| Newry | 82 | 215 | 347 | 423 | 386 | 490 | 306 | 217 | 2,467 |
And the same months on a 6kW system.
| Town | Feb | Mar | Apr | May | Jun | Jul | Aug | Sep | Feb to Sep |
|---|---|---|---|---|---|---|---|---|---|
| Armagh | 132 | 310 | 496 | 592 | 533 | 689 | 426 | 304 | 3,481 |
| Ballymena | 121 | 290 | 489 | 612 | 502 | 656 | 408 | 267 | 3,344 |
| Belfast | 129 | 320 | 523 | 623 | 554 | 734 | 436 | 326 | 3,645 |
| Derry | 138 | 297 | 483 | 570 | 517 | 606 | 393 | 292 | 3,295 |
| Enniskillen | 131 | 283 | 461 | 594 | 521 | 659 | 403 | 289 | 3,341 |
| Lisburn | 127 | 294 | 498 | 618 | 538 | 717 | 449 | 296 | 3,536 |
| Newry | 123 | 322 | 520 | 634 | 580 | 736 | 460 | 326 | 3,701 |
January is left out of both tables because the tracker started on 24 January, giving only eight days in that month. Those eight days are in the year-to-date totals above: 17 kWh on a 4kW system in Belfast.
What the monthly pattern actually shows
July was the strongest month in all seven towns, without exception. Belfast made 489 kWh on a 4kW system, an average of 15.8 kWh a day, with the tracker logging 9.1 hours of sunshine a day across the month.
June came in below May in all seven towns, which surprises people. Belfast made 415 kWh in May and 369 in June. That happened despite 25 June producing the hottest June day Northern Ireland has recorded in 50 years, 30.8°C at Castlederg, provisionally equalling the June record set on 30 June 1976. Heat and generation are different things, which is a point I come back to below.
August fell off a cliff relative to July. Belfast dropped from 489 kWh to 291, a fall of 40 per cent in a single month, and every other town moved the same way. If you are budgeting on summer output, August is not a summer month in NI generation terms.
September dropped again, by between 25 and 35 per cent on August depending on the town. Belfast made 218 kWh, which is 44 per cent of its July figure.
February, the earliest full month in the record, gave a Belfast 4kW system 86 kWh across 28 days. That is 3.1 kWh a day, about a fifth of July, on an average of 2.9 hours of sunshine a day. Our guide to solar panel performance in winter goes into what that means for a household through the dark half of the year.
The best and worst tracked days in Belfast
| Rank | Date | 4kW kWh | 6kW kWh | Sunshine hours |
|---|---|---|---|---|
| Best 1 | Sun 21 Jun 2026 | 24.80 | 37.20 | 15.55 |
| Best 2 | Mon 13 Jul 2026 | 24.10 | 36.20 | 15.06 |
| Best 3 | Tue 14 Jul 2026 | 23.60 | 35.40 | 15.00 |
| Best 4 | Thu 25 Jun 2026 | 23.50 | 35.30 | 15.00 |
| Best 5 | Tue 26 May 2026 | 23.40 | 35.10 | 14.97 |
| Worst 1 | Fri 6 Feb 2026 | 0.50 | 0.80 | 0.00 |
| Worst 2 | Mon 26 Jan 2026 | 0.50 | 0.80 | 0.00 |
| Worst 3 | Tue 10 Feb 2026 | 0.80 | 1.20 | 0.00 |
| Worst 4 | Thu 12 Feb 2026 | 0.80 | 1.20 | 0.00 |
| Worst 5 | Wed 18 Feb 2026 | 0.90 | 1.30 | 0.00 |
The five worst days in the Belfast record all fell in late January and February, each under 1 kWh on a 4kW system with no recorded sunshine at all. They are in the table because the brief for this page is honesty about the whole dataset, not a curated top end.
The best day is worth dwelling on. It was the solstice, 21 June, not the record-heat day four days later. Panels lose a little efficiency as they warm, roughly 0.3 to 0.4 per cent per degree above about 25°C, so the hottest afternoon of the year is rarely the most productive one. What drives output is the length and clarity of the day. On 21 June a 6kW Belfast system modelled 37.2 kWh, which is roughly four days of electricity for a typical NI household in one go.
Best day of 2026 in each town
| Town | Date | 6kW kWh |
|---|---|---|
| Belfast | 21 Jun 2026 | 37.20 |
| Lisburn | 13 Jul 2026 | 36.80 |
| Armagh | 13 Jul 2026 | 36.00 |
| Enniskillen | 14 Jul 2026 | 35.90 |
| Newry | 14 Jul 2026 | 35.90 |
| Derry | 14 Jul 2026 | 35.80 |
| Ballymena | 14 Jul 2026 | 35.70 |
Every town in Northern Ireland had its best day of the year inside a four-week window, and six of the seven landed on the same two days in July. When the Atlantic steps aside, it steps aside for all of us at once.
Does your town matter?
Less than you would think. Over 250 days the gap between Newry at 2,486 kWh and Derry at 2,214 kWh on a 4kW system is 12 per cent. The five towns from Lisburn down to Derry sit within 8 per cent of each other.
Roof orientation moves the number further than geography does. A due-south roof at a normal pitch is the benchmark these figures assume. Turn that array east or west and you give up roughly 10 to 15 per cent of the annual total, and you get a flatter daily curve in exchange, which can suit a household that uses electricity steadily through the day. Shading from a chimney, a gable or a mature tree can cost more than either.
That is the practical reading of the town table. Living in Derry rather than Newry puts you about 11 per cent behind the best town in the sample, and one badly-placed tree would cost you more than that.
Of those 368 quote requests, 235 were for detached houses and 246 came from households with a monthly electricity bill between £100 and £250. The generation figures above are the supply side of that arithmetic. What you do with them depends on your own usage pattern.
September 2026
All 30 September days are in the record, every one based on recorded weather.
| Town | 4kW kWh | 6kW kWh | Change on August (4kW) |
|---|---|---|---|
| Belfast | 217.6 | 326.0 | down 25.1% |
| Newry | 217.3 | 325.7 | down 29.1% |
| Armagh | 202.5 | 303.9 | down 28.7% |
| Lisburn | 197.6 | 296.2 | down 33.9% |
| Derry | 194.1 | 291.6 | down 25.8% |
| Enniskillen | 192.8 | 289.3 | down 28.2% |
| Ballymena | 177.7 | 267.4 | down 34.7% |
That is 7.3 kWh a day in Belfast against July’s 15.8. Friday 18 September was the worst day in five of the seven towns, and Belfast’s best was Friday 4 September at 13.3 kWh on a 4kW system. The town-by-town best and worst days, and what the month was worth at the old and new Power NI export rates, are in the September 2026 solar generation report.
How the tracker works
I want this to be checkable, so here is the whole method.
Each morning the tracker pulls daily weather data from Open-Meteo for seven locations: Belfast, Derry, Armagh, Newry, Enniskillen, Lisburn and Ballymena. Each town has its own coordinates and its own reading. The field used for generation is shortwave_radiation_sum, the total shortwave radiation falling on a horizontal square metre that day, converted from megajoules to kWh by dividing by 3.6. Sunshine hours come from sunshine_duration, converted from seconds.
Generation is then the standard PV yield equation:
Energy (kWh) = radiation (kWh/m²/day) × system size (kWp) × performance ratio
The performance ratio is fixed at 0.78. That is the allowance for inverter losses, panel temperature, orientation, soiling and wiring. UK residential systems typically land between 0.75 and 0.82, so 0.78 sits at the conservative end on purpose. Value is the resulting kWh multiplied by a 33.5p per kWh tariff assumption.
Five things this method does and does not do:
- The weather input is measured, not forecast, for every day in this page. Today’s figure on the live tracker is a forecast until the day closes, then it firms up to observed.
- The model is linear in system size, so every 6kW figure on this page is exactly 1.5 times the 4kW figure. The 6kW column is not an independent measurement.
- It models a well-sited, unshaded, south-facing array at a typical NI roof pitch. Your roof will be above or below this.
- It takes no account of panel age, degradation, inverter clipping or snow.
- Days are classified by radiation for the live tracker: brilliant at 5 kWh/m² or above, bright at 3.5, mixed at 2, overcast at 1, dull below that. Across the 2026 record to 5 September that gives 275 brilliant days, 263 bright, 531 mixed, 315 overcast and 191 dull, counting each town separately.
One correction to declare. For 24 January to 12 February 2026 the weather feed returned no data and the tracker stored zeros for all seven towns. On 23 September 2026 those 140 town-days were corrected from the Open-Meteo archive, and every figure on this page includes the corrected days.
If your own system is more than about 15 per cent below the town figures here in a given month, on a comparable roof, something is worth checking. Soiling, a shading change, a failing optimiser or a string that has dropped out are the usual causes.
Cite this page
If you are quoting these numbers in an article, a planning document or a quote comparison, please cite them properly and link back so readers can see the method:
Compare Solar NI, Northern Ireland Solar Generation Tracker 2026, comparesolarni.com/guides/northern-ireland-solar-generation-2026/, checked 1 October 2026.
How this page is kept current
The live daily figures for all seven towns are on Solar Today, updated every morning. This page is the evergreen record, and I update it at the start of each month with the previous month’s completed figures and a short dated note on what the month did. The tables above will keep growing rather than being replaced, so a figure you cited in September will still be there in March.
Where to take this next
Generation is one half of the decision. What it costs to buy the array is the other half, and that is covered in our Northern Ireland solar panel costs guide, with the size-by-size breakdown in solar system sizes and costs in NI. If you want the two halves put together into a payback figure, are solar panels worth it in Northern Ireland does that arithmetic with current NI prices and tariffs. And if the question behind all of this is whether panels do anything useful under NI cloud, how weather affects solar panel efficiency explains why a bright overcast day still produces.
The short version of 250 days of tracking: a 4kW roof in Northern Ireland would have produced between 2,214 and 2,486 kWh from late January to the end of September 2026, worth £642 to £833 depending on your town and your tariff, with July doing nearly six times the work of February. That is the honest number, and it is now on the record.

Written by Connor McAuley
Founder and editor of Compare Solar NI. Connor writes the site's Northern Ireland solar guides and runs its weather-based generation tracker. He does not install panels or sell hardware.
Meet the person behind the site · How we make moneyQuestions readers ask
How much do solar panels generate in Northern Ireland?
Between 24 January and 30 September 2026, our tracker modelled 2,214 to 2,486 kWh from a 4kW system across seven NI towns, and 3,321 to 3,729 kWh from a 6kW system, over 250 tracked days. Belfast came in at 2,445 kWh on 4kW. That figure excludes October to December, so a full calendar year lands higher, but the seasonal shape is already clear: in Belfast, July produced nearly six times what February produced.
How much does a 4kW solar system produce in NI in a month?
In Belfast during 2026 the monthly figures were 86 kWh in February, 213 in March, 348 in April, 415 in May, 369 in June, 489 in July, 291 in August and 218 in September. July was the best month in all seven towns we track, and February the worst of the measured months.
Which town in Northern Ireland generates the most solar?
Newry led the seven towns over 250 tracked days in 2026 with 2,486 kWh on a 4kW system, followed by Belfast on 2,445 kWh and Lisburn on 2,373 kWh. Derry was lowest on 2,214 kWh. The gap between top and bottom is about 12 per cent, which is smaller than the difference a south-facing roof makes against an east-facing one.
What was the best solar day in Northern Ireland in 2026?
In Belfast it was Sunday 21 June, the summer solstice, when a 4kW system modelled 24.8 kWh and a 6kW system 37.2 kWh from 15.55 hours of sunshine. Across the other six towns the best day was 13 or 14 July. Lisburn's 13 July reached 36.8 kWh on 6kW, the highest single day outside Belfast.
Do these figures come from real solar panels?
No, and we say so plainly. They are modelled from measured daily shortwave radiation supplied by Open-Meteo for each town, using the standard PV yield equation: radiation in kWh per square metre, multiplied by system size in kWp, multiplied by a performance ratio of 0.78. The weather input is measured. The generation figure is what a well-sited south-facing array would have made from that weather.
How much is that generation actually worth in money?
The tracker values every unit at 33.5p per kWh, so a Belfast 4kW system's 2,445 kWh to 30 September works out at £819. At a lower 29p tariff the same output is worth £709. Both are the gross value of the electricity produced. The cash you keep depends on how much you use as it is made, because exported units earn single pence rather than the 30p-plus you pay to import.
How much do solar panels generate in an NI winter?
Very little compared with summer. February, the earliest full month in the 2026 record, gave a Belfast 4kW system 86 kWh across 28 days, about 3.1 kWh a day. July gave the same system 489 kWh, about 15.8 kWh a day. Winter output is real but small, which is why annual totals rather than any single month decide whether a system pays.
Is Northern Ireland worse for solar than the rest of the UK?
It is lower than the south of England, and the difference is real rather than dramatic. Over 250 days in 2026 a Belfast 4kW system averaged 611 kWh per kWp installed, and that period excludes the three months from October to December. NI electricity prices are higher than the GB average, which pushes the payback maths back in the other direction.
Your next step
See what your options cost.
Request quotes from participating Northern Ireland installers. Compare the equipment, installation and aftercare. You decide whether to proceed.
Are Solar Panels Worth It in Northern Ireland? The 2026 Numbers
Payback for a 4kW and 6kW system in Northern Ireland, built on this site's own 2026 generation tracker corrected for a pitched roof, at the calculator's 33.1p and three real NI unit rates. When solar is worth it, when it is not, and what it means if you heat with oil. Checked 23 September 2026.
Solar Panel Costs in Northern Ireland: 2026 Prices by System Size
Solar panel prices in Northern Ireland from £5,000 to £12,000. See costs by system size (3kW to 6kW), what is included, battery add-on prices, and how to reduce your bill.
Solar Panels in Winter: How Much Energy Do They Generate in NI?
Month-by-month solar panel output data for Northern Ireland. Winter vs summer generation, how to maximise cold-weather performance, and real 4kW system figures.